12/28/2009

NEP is one of the Biggest Bubbles, Ever!

You can see my previous posts about NEP here. As you can see, I’ve been wrong about where NEP’s rally will stop. These have been short term calls, so I believe I will be vindicated in the longer-term price action. I am going to prove to you that NEP is the biggest bubble ever, and that after the kind of move that we've seen in the stock price over the past 3.5 years will likely be followed by some years of stagnation, regardless of where this current spike peaks. The question will be whether you can sell in time to lock in your profits.

Let’s begin by examining NEP’s price action for the past 3.5 years (see the chart below which shows NEP’s weekly price candles).

122809_nep_weekly

The first aspect to which I’d like to draw your attention is a revised wave count. After reconsidering my previous wave count analysis, I believe we’re actually in the final thrust of a 5-wave sequence that began in 2006. This makes more sense, because the triangle from which we just broke out is normally a terminal pattern, meaning any rally is often fully retraced.

The second aspect deals with NEP’s raw price performance. In mid-2006 (7/17/06), NEP bottomed at $.17. Today, NEP closed at $9.16: a 5,288% return in just under 3.5 years, or 210% annualized growth for 3.5 years straight. No big deal, right? Many great companies out there have seen these kind of returns in their early years, right? This kind of growth should be possible, shouldn’t it? Let’s look at some facts: here is a list of great companies followed by their best lifetime stock performance, as well as their best 3.5y performance:

Company

Max Lifetime Gain

Time Period (y)

Best Annualized Gain

Best 3.5y performance

Amazon (AMZN) 9,187% 12.5 43% 1,503%
Hovanian (HOV) 1,042% 13 18% 1,437%
Research in Motion (RIMM) 9,283% 9 63% 1,397%
Apple (AAPL) 7,273% 25 18% 1,254%
Wal-Mart (WMT) 122,940% 27 30% 1,011%
Microsoft (MSFT) 59,538% 14 59% 693%
Barrick Gold (ABX) 10,946% 23 23% 686%
Proctor & Gamble (PG) 10,460% 38 13% 205%
China Northeast (NEP) 532%* 6 28% 5,288%

*(Note: NEP’s lifetime gain is so low because the stock started trading at $1.50, significantly above it’s lowest price of $.17, 3.5 years ago)

To be fair, I looked to see if AMZN did have similar growth over a smaller period. In fact, in the first 2.5 years after going public, AMZN did appreciate by 5,423%! But there are two key differences between AMZN and NEP: 1) this performance occurred at the height of the tech bubble; 2) AMZN was introducing a revolutionary service that warranted being rewarded with faster stock appreciation, while NEP is a simply drilling oil (what’s the big deal?).

Thus my conclusion from this data is that NEP’s 3.5y price performance has been ABSOLUTELY EXCEPTIONAL AND ABNORMALLY HIGH, given the un-uniqueness or lack of novelty in the business that would normally spur bubble-like performance.

My next thought related to price performance is that perhaps since it was a penny stock, such a massive move is not out of the ordinary, as you’ll often find 1000%+ moves in pump/dump stocks. Here are a couple such bubble charts that came to mind immediately (JRJC and MXC):

122809_jrjc_weekly 122809_mxc_weekly

Notice the typical reaction is long-term downtrend, and these stocks only rallied 1,000%-1,500%. Now let’s compare these charts to a non-log NEP chart, and tell me if you don’t see a similarity:

122809_nep_daily

NEP has been profitable since 2006/07. How is it possible that the market has mispriced this company so severely? An Oil-drilling company especially? What is so amazingly unique about this company that the market misjudged its profit potential at the beginning? How could it have been discounted this low? How is it possible that NEP was so underpriced to begin with that early shareholders have enjoyed 210% return per year for 3.5 years???? Has the market really been so inefficient, or is there something else going on?

Therefore, if you’re a long-term investor, ask yourself if buying at this point, after such a massive run over a relatively short period of time, makes sense. Sure, with the momentum of this move, it could double again, but this wouldn’t really change things much in the longer-term picture. When a stock goes parabolic, it will often retrace to the beginning of the parabola before starting a new run up. This indicates a retrace to $4-5.

In conclusion, make your NEP decisions knowing that history does not reward these kind of rapid moves over the next couple years. Ask yourself where the market went wrong such that it allowed the company to be so undervalued to begin with. Or, on the other hand, maybe you are part of the most obvious 10-bagger in the world (everyone has been touting NEP for a long time, well done!!). One thing I’ve noticed is that the market never rewards the obvious point of view in the long run.

Everyone, please find flaws in my logic, I'm all ears. Thanks for reading! I am wishing everyone best of luck in being able to sell their stock at high prices and booking the 'profits' that everyone has been bragging about! GOOD LUCK!

P.S. You can tell me all about P/E, valuation, etc. but I believe raw price performance will be the final factor in determining supply/demand, as history has shown in many other cases!

12/23/2009

Interesting formation on QQQQ

I last wrote about the overall market here. As you can see, since then the market has not made very much overall progress. Today, I noticed an interesting pattern on the QQQQ ETF that tells me that this could be a terminal thrust in this rally.

122309_qqqq_weeklyAbove is the weekly chart of QQQQ highlighting my Elliot Wave count. I believe that the rally we’ve seen in 2009 is actually a triple-zigzag, a corrective move. I’ve come to this conclusion because there are no clear 5-wave moves in this rally; rather what I see is a collection of 3-wave moves that overlap significantly. Also, notice that volume has been dropping, and MACD is nearly curling over. Finally, notice that price is back-testing the uptrend line that it broke back in October.

122309_qqqq_daily The short term picture tells me that we’re nearing the end of this holiday rally. Notice that QQQQ consolidated in a very clear triangle before breaking out this past week. As I’ve mentioned many times before, triangles are normally patterns that precede the terminal thrust. Often, price will go up an amount equal to the height of the triangle. This projects a high of 45.62, where we are right now. Be careful if you’re long and complacent.

Happy holidays!

12/18/2009

There could be a strong correction in the dollar soon

Though I am bullish longer-term on the dollar, as you can see here, I think we could actually see a strong drop in the near term.

Take a look at the Commitment of Traders for the dollar index above. Notice that commercial traders have rapidly grown a huge net short position as the dollar has rallied. If you look back to the previous time there was a similar net short position, there was a large 5-pt drop in a short period.

The Character of the Dollar's Rally is Different

You can see here that I've been following the progression of the EUR/USD for some time. I have been bullish the dollar, and thus bearish EUR/USD, because I believe that the majority of investors believe the dollar is in for a crash. Anyway, the dollar rally appears to have legs, and I think at a minimum, we'll see the dollar index hit 82 before it would make new lows, it at all.

You can see on this chart (daily candles) that /DX has made the largest counter-trend rally of the entire downtrend. This tells me that the character of trading has changed in the dollar. I believe this new rally is actually the start of an uptrend. It seems that the market corroborates this point of view because you can see that volume has been markedly higher in this rally. Even if we see a downward correction at this point, I would expect the dollar to then make a new trend high. It'll be fun to see what happens!

12/11/2009

NEP Technical Picture

NEP just broke to new highs today. Everything about this looks great! We know the company is excellent, as you can see from my brother's posts (Is NEP Buying More Drilling Rigs, NEP 2010 Earnings Projections, NEP's Newest Addition--Tiancheng Drilling and Oil Services, and NEP Update after Q3 Results). However, in my experience when everything is perfect, and optimism abounds, it's time to take at least short term profits. I expect a drop to $5 from the $7.00-7.50 level.

On the daily chart above, you can see that we just broke out of a massive triangle consolidation. However, these types of thrusts are often quickly retraced, even if just part of a correction. I could see a retracement to the $5 range, which should correct most of Wave-(i) of Wave-iii.

On this chart, you can also see that the up move has been quite parabolic, and the breakout has come after the overall stock market has made a big up-move. Clearly NEP isn't playing a leadership role. If this stock was breaking out to NEW highs near the beginning of the rally, I would trust this price action more. However, when it's one of the last stocks, I think this stock is getting ready to wipe out all the optimism :).

Good luck!

12/07/2009

Finally!

EUR/USD just made a lower low after making a lower high. So far, the downtrend is confirmed. Let's see how long it lasts!

12/05/2009

That should do it

I don't think there is any question that the EUR/USD has broken its uptrend now. If it does reverse once again and head higher, I think I'll quit trading.

12/01/2009

The EUR/USD just won't break it's uptrend

You can my post here from last week indicating the EUR/USD uptrend was broken. However, we got a quick reversal that brought price back above the trendline. My bigger picture assessment remains the same, however. I think the EUR is completing a topping process.

You can see my wave count for the EUR/USD. It looks like Wave-IV is subdividing nicely, with Wave-v taking shape as an ending diagonal. I could see a rally to 1.52 to complete this pattern, then we should enjoy a sharp sell off, similar to what we had during Thanksgiving.

11/28/2009

Is NEP already buying more drill rigs?

In my previous post, my 2010 projection for NEP, I based my revenue projections for newly acquired Tiancheng Drilling on the assumption that the company was going to operate 7 rigs for the duration of 2010. In figured this made sense to be conservative even if NEP bought more rigs at some point during the year.

I've been looking through the 10-Q again as I work on my long term projections and I noticed that on Sept 30th 2009 the company showed prepaid expenses for:
Deposits paid for puchase of drilling equipment $3,363,753


I can't think of any scenario other then Tiancheng had already contracted to purchase more drill rigs. I have no idea how much one of these would cost, but based on the $12mil in fixed assets they gained buying Tiancheng, I'm guessing a Rig costs anywhere from $1.5-2mil. In this case its possible that NEP is buying 2 or 3 more rigs, assuming a 33-50% prepayment.

Any thoughts or further information on this?

11/27/2009

Parabola's reverse hard

Check out the chart below and see if you can figure out what it is:
Can't guess? It's a flipped chart of gold. Notice the clear parabolic action in the past few months. Today we got a panic $60 selloff in gold (rally in this chart). Either we get one more panic buying spree in gold to complete the parabola, or start a sharp downtrend. Regardless of the short term action, I think gold's days are numbered. I think we may be witnessing an irregular ABC flat correction, where Wave-B goes higher than the previous peak. In this case, we will see an extremely sharp counter-move which should break below the Wave-A low. I could see a drop to 600 in gold. This would be excellent to destroy the bullish sentiment that has developed on metals.

Another reason why I'm bearish on gold is that many of the mining stocks are looking ultra-bearish. Take a look at ABX above. Even in the midst of nearly-1200 gold, ABX couldn't make a new high. Furthermore, it has carved out an extremely bearish ending-diagonal pattern. This foreshadows a drop to at least $25, but I would not be surprised to see a drop to $15.

Not Looking pretty

Hang Seng is also looking very, very weak. Good luck out there for longs!

Notice it formed a very clear ending diagonal. This puppy looks ready to crash to at least 19,500, if not start a new leg to retest the lows.

11/25/2009

Let's not forget

Let's not forget where we stand in the bigger picture. 10520 in the Dow is a very important resistance, and at the very least, I expect a few weeks downside from here.

The 3-day chart above shows that price is retesting a long-term downtrend line on $DJI. Also, Wave-C = Wave-A at 10,520, so the entire correction may be nearing an end. People seem to assume now that the market won't drop, and that the dollar will continue dropping. Good conditions for a contra-move.

11/23/2009

NEP 2010 Earnings Projection

Introduction

Even though we haven't finished 2009, China NorthEast Petroleum (NEP) has given us a solid, yet conservative guidance for Q4, so I am looking forward to 2010 with my projections in this post. I've come up with four scenarios to present, based on what oil prices might do next year. My nature is to be conservative when I create forward looking projections, so just know that when looking at the numbers.

In order to make the projections I've split NEP into their two operating segments, Drilling and Oil Production. We don't have much more information on the Drilling segment then what I presented in my last post on NEP, so I will be basing my estimates mainly on info from the press releases and the 10-Q.
As for the Oil Production numbers, I have been keeping a detailed spreadsheet of NEP's past financial results, as well as projections based on those past results, for two years now. At this point I feel that I have a very good handle on what levels of expenses to expect based on oil production and oil price levels. In my projections I won't be showing all the details, just the projections for producing wells, average oil price, revenues, and net income. But know that these numbers come from my more detailed spreadsheet.

Lets quickly look at the major factors to consider when projecting revenues and expenses. This only applies to the oil production as for Tianchiang I've simply assumed they will drill 220 wells, receive about $185k per well, and have a 30% profit margin.


Revenues
Obviously the main consideration is the average oil price. My brother (see his last post here) and I believe that the US Dollar will strengthen in the coming months, and I also expect the US to relapse into a 2nd recession next year, so I'm not one of those people expecting oil over $100 again next year. The other factor is the level of production. I've assumed increasing production as the year progresses based on NEP's stated plan to add another 60-70 wells.

Expenses
Cost of Sales:
Production Costs: NEP incurs about $5/barrel
Depreciation: This numbers ran between $9.50 and $10 per barrel in 2009.
Government Oil Surcharge: China charges a tax on on oil revenues when oil is higher then $40/barrel. This tax starts at 20% and increases to 40% on the price over $60. See NEP's explanation on page 29 of their 10-Q
General and Admin:
NEP has low G&A costs. Typically they have about $1mil in general operating costs, and then another $750-1000k interest and amortization expenses on the loan they received in 2008.
Taxes:
NEP's tax rate this year has been about 32%.


Scenarios:
Now that we've gone over my assumptions, here are the four scenarios:

1. Oil stays in a tight band all year between $60-70, averaging $65 each quarter (extremely unlikely but a nice base scenario). In this case NEP would have about $1.21 EPS in 2010.


2. Oil moves down in the first half of the year and then back up, but finishes next year lower then it is today. This is my favorite conservative projection. In this case NEP would have about $1.07 EPS in 2010.


3. The world enters another serious recession and deflation hits. Oil drops from current levels to about $35/barrel in the 2nd half of the year. I really doubt this would happen, but wanted to put it in to show that NEP will still earn about $.60 EPS even in this "shit hits the fan" scenario.

4. Continued inflationary pressures and a greater concern by the market that peak oil has arrived pushes prices up throughout the year to end 2010 at about $100/barrel. This would be ideal for us and NEP would have about $1.45 EPS in 2010 if this happened.


2010 NEP price expectations

Having been invested in this great company for two years now, I have come to realize that the stock will never move like you would expect it to. Still, 2010 seems primed to become the company's best year yet, and thus I do expect the stock to have a nice run-up in the next 12 months. Assuming that NEPs meets their projections of $.80/share in 2009, today we have a stock with a TTM PE of 6.5 ($5.20/$.80), that will likely earn between $1.05 and $1.10 next year even if oil drops 15% from today's prices, and will earn $.60 even if oil tanks back down to early 2009 levels.
I find it hard to believe that we will still sport a PE under 10 in a year (although its not impossible), so I think that we should see this stock hit $10 by next fall. that's a 100% gain from today's levels. If more institutions find the stock and it gets on a roll, it would not be out of the question to see a PE of 15-20 on it, which would move the stock to $15-20. This is what all of us owners are dreaming about, but I'm certainly not expecting this yet.
Of course, caution is also warranted because if oil prices move down to the $35-40 range again, I'm sure we could see this move under $3.50 again, and possibly down to $2.50. Just know that at that level you'll be picking shares up for 4x their worst earnings potential.


The bottom line is that this a very well managed company that isn't taking crazy risks in order to increase their stock price. Management is clearly thinking long term and I believe that that in 10-15 years any stockholders that have held the stock the entire time will be very happy, but I will go more into that in my next post.

11/22/2009

EUR/USD breaking down

As I mentioned in this post, I thought that the EUR/USD would continue to weaken because of the divergence that it was showing against the US Dollar index. We've had choppy downward action, and I think we're getting ready to start the fast phase of the decline. Watch 1.46 as a downside pivot.

You can see in the daily chart above that EUR/USD finally closed convincingly below the uptrend line that has been supporting price action since March. Unless we get another quick spike back above the trendline, I think we'll be in for continued weakness. Keep an eye out on this.

11/19/2009

NEP's newest addition, Tiancheng Drilling and Oil Services

On October 1st, China Northest Petroleum (NEP), announced that they acquired another company, Tiancheng Drilling Engineering Co. Ltd. As NEP put it in their press release, the "Acquisition Expands Company's Vertical Integration Within China's Oil E&P Industry." At the time I was interested to see the purchase, but also curious as to what the net financial effect would be, so I decided to wait until the Q3 10-Q before coming to a conclusion.

In the initial press release we received some nuggets of info on the new company and what it might add to NEP's overall revenues and earnings. Some highlights are listed below:

-NEP paid $13mil in cash for the entire company
-Seven rigs in operation.
-320 employees
-Capacity to drill 220 wells annually
-One of three PetroChina- licensed private drilling operators
-NEP has not utilized Tiancheng for drilling services in the past.
-2008 revenue of approximately $14.7 million, net profit of $5.2 million
-cash flow positive from operations.

For me the two key points from this release were the $5.2mil profit and the fact that they were also cash flow positive from operations. $5.2mil is extremely good considering it only cost $13mil to buy the whole company, so I wondered if perhaps 2009 was not being so kind to Tiancheng and thus I couldn't wait for the 10-Q to come out.
On Monday we were finally able to see Tiancheng's results during the first nine months of the year, and NEP also provided us with some addition pieces of information about their acquisition throughout the 10-Q. I've copied some from pages 28-29 below:

"Tiancheng enters into drilling contracts with PetroChina and other private oil companies to provide oilfield drilling services, and generates revenue based on the depth of each well drilled for clients. Clients will typically pay 30% of the total projected drilling costs as a down payment to start the drilling process, and pay the remaining balance within 12 months according to the specific contract term.
In the first nine months of 2009, Tiancheng has completed contracts to drill 80 shallow wells, which include 74 wells for state-owned PetroChina Jilin Branch and six wells for non-state-owned Daqing Shunwei Energy Development Co. Ltd. The total drilling depth accomplished this year is 105,896 meters (~347,428 feet), with the revenue of $14,700,455 and net income of $4,820,661 or $0.22 in fully-diluted, pro forma EPS for nine months ended September 30, 2009. Tiancheng currently has existing contracts to drill 86 additional wells, and more contracts are under negotiation to increase the utilization of rigs and continue to grow sales revenue"

Page 8 also shows the combined 3-month and 9-month results of the two companies. Below are three tables showing revenues and net income for NEP and Tiancheng as separate entities, and then results of the combined company if the transaction had occurred at the beginning of 2009.


A couple things also popped out at me looking at the numbers:
1. through the first 9 months Tiancheng completed 80 wells, generating $14.7mil in revenues, or about $185k per well.
2. NEP expects to generate about $13mil in Q4, which would mean completing 70 wells if the average revenue per well stayed the same.

It will be interesting to find out how almost as many wells will be done in the 4th Q as during the rest of the year. I assume that they are fully booked at the moment and that earlier some of their rigs were not being fully used, or perhaps some of the rigs were only purchased mid-year. Another possibility is the fact that drilling can be difficult during the rainy season.

What is clear to me is that this was a phenomenal purchase by NEP's management. Not only does this diversify the company's source of revenues, the purchase also increases the top line of the combined company by about 50% and the bottom line by 65% for 2009 (using Q4 est provided)!! NEP now has another steady source of cashflows that will allow it to continue its expansion program even if oil prices fall into the $40s again.


PS: Watch for my 2010 pr0jections post coming in the next couple days.

11/18/2009

NEP update after 3Q results

China Northeast Petroleum (NEP) announced their 3rd Q earnings this morning, along with 4th quarter and full year guidance. As usual, the company set another quarterly production record and had solid positive earnings.
In this post we will examine the company's performance over the last few years. I am also working on a 2nd post which will present my projections for the company in 2010 and future years.

I have had a substantial (for me anyways) position in this stock for two years now and what has been very interesting for me to see is that so far the performance of the actual company has far outperformed the stock performance. That is pretty impressive considering that the value of my position has doubled.

Historical Performance


The table and chart below show actual results for NEP's last 15 Qs, as well as projected data for the 4th Q09 based on estimates provided by the company in their recent earnings release. It is important to note that the estimates for Q4 DO NOT include projected revenues ($13mil) and net income (est about $4.6mil) of NEP's newest acquisition, Tiancheng, an oil drilling and services business. I have expressly left this new source of revenue and income out of the Q4 Est in order to show only the oil production results. The new company will be an important source of new revenues which I will discuss in the 2nd post.

Q4 estimates assume $65/barrel average oil prices based on the Mean of Platts Singapore index during the months of Sept, Oct, and Nov (this is because NEP is paid the previous month's price for oil delivered each month). This index requires a paid subscription, but thanks to Nawar on the Yahoo MBs, we can use the average price of Cinta crude on the Indonesian Crude Price index as an appr0ximation (recently Cinta has been about $1/barrel higher then the MOPS price received by NEP as per their recent 10-Q).


The company has clearly done an excellent job exponentially increasing both revenues and net income over the past four years. This growth has come mainly due to a 12-fold increase in production, with some help from higher oil prices. During the middle of 2008 the company was clearly helped by record oil prices, but it also proved that it could earn a reasonable profit even with oil averaging $40 as it did in Q1 2009. As can be seen by the chart below (courtesy of Stockcharts.com), investors were worried that the company would have serious issues making a profit on $40 oil, driving the price of the stock down to $1.25/share in March 2009. An $.11 EPS for Q1 2009 was enough to show investors that their fears were unfounded, and subsequently the stock price moved from $1.25 to over $5 in the next three months.


Today the stock trades at $5.16, with TTM earnings of $.78/share, meaning that the company trades at a trailing PE of about 6.6. Not a bad deal for a company whose revenues and earnings are both at least 12 times higher then they were 3 years ago.

In the next couple days I plan to post my projections for 2010 earnings, as well as look at what we could expect this company to look like in 5-10 years.

If anyone has any questions they would like answered in the next post or comments, feel free to leave them.


PS: Thus far, I have not fulfilled my part of the plan my brother and I had when we started themarketbrothers blog. Going forward I am planning to continue making contributions. You'll notice quickly that my posts will tend to be more fundamentally oriented, while my brother prefers technical analysis.

11/16/2009

US Dollar Index Divergence with EUR/USD

A week ago, I noted that /DX had made a lower low while many of the major currencies in the basket which comprise the USD index did not make similar higher highs. Today, the divergence continues, and until it is canceled, it looks like /DX could have a serious rally in store.


The above 1h charts are /DX on the left, and EUR/USD on the right. Notice again that EUR/USD has yet to breach the previous high, whereas /DX has clearly breached it twice now. This is bearish divergence for the EUR/USD, and looks bullish for /DX, as long as EUR/USD does not rally to new highs.

11/10/2009

MON Update

Just an update on Monsanto (MON). After breaking through a bearish channel, MON has retested this breakdown zone on a short-covering rally inspired by a reaffirmed guidance from management. This is a picture perfect opportunity to add to shorts. If price closes above the trendline for 2-3 days, then it's time to consider covering. Thus the exit strategy on the downside could be to cover if price breaks above 78.71 and closes above the trendline.

11/09/2009

WTF???

/DX made a new low today. Only 1 other major USD pair has made a similar move (GBP/USD). The other major pairs, especially the heavily weighted EUR/USD, have not reflected this new low in /DX. I don't know what to make of this, but it seems that there are some short term manipulations in play, because it is not possible for USD to be at a new low when 5/6 other currencies don't reflect this. This could imply that /DX is washing out the bulls before a strong blast-off.

The top-left chart is /DX. Notice it made a new low. Clockwise from /DX, you can see EUR/USD, GBP/USD, USD/CAD, USD/CHF, and NZD/USD. Was GBP/USD's breakout really strong enough to bring the whole /DX index to a new low? Seems doubtful to me.

Edit: USD/JPY and USD/MXN (two other relatively import trade partners used to calculate /DX) are also both high off their lows.

10/30/2009

Monsanto update

I last posted about Monsanto here. I was calling for declines based on a severely underperforming stock price. Currently, it looks like things are unfolding according to plan. If we rally to $75 or so, I may add more to my short position.

You can see in the weekly chart above that MON has broken it's bear flag pattern to the downside, and looks like it will easily close the week below. I would like to see a rally to $75, a retest of the breakout line, to add more shorts.

10/21/2009

Distribution keeps on coming...

...the smart money unloading on the dumb money. We now have 7 distribution days in the past month, and MACD divergence. Watch out below!

(you can see the distribution days and MACD div on the SPY daily chart above)

Furthermore, we're getting major divergence on the 5- and 10-dma Advance/Decline issues. Much fewer stocks participated in this last rally from the October lows. We're heading down :).


10/20/2009

"Could Apple's Run be Over?" -- Revisited

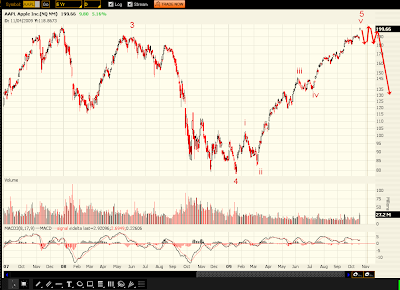
Back in Spring '08, when AAPL was making it's 2nd major test of $200, I projected that it was possibly at the end of its bull-market. We're now back at $200 and AAPL has just reported it's best earnings ever. Once again, however, I am pessimistic on AAPL's future. I believe we are within $10-20 of it's high price for the next couple years.

Above is AAPL's weekly chart. From an Elliot Wave perspective, notice that it is nearly finished with a 5-wave rally since its resurgence when Steve Jobs retook the helm as CEO in the late 1990's. Notice that throughout the bull run, up through the end of Wave3, there had been increasing volume (even at higher share prices). However, on this 5th wave advance from $85, volume has been shrinking. In Elliot Wave Principle, Robert Prechter explains, "...look for lesser volume as a rule in a fifth wave as opposed to the third." This is exactly what is happening now, not a very bullish sign going forward. My downside target range is from $50-80.

So, if we are in the fifth wave of AAPL's advance, how close is it to being finished? The wave count is a little bit unclear, but there are 5-waves up, so it could be nearly complete. It would be funny if the earnings pop left an island top in place, but I'm open to the possibility that we head a bit higher and form a topping pattern before reversal.

On a different note, I did see some bearish option activity today as well. My Jan '11 40 put on AAPL actually increased in value today, in the face of a 5% spike up. Clearly someone is willing to bid up the OTM, long-dated options on this strength.

Anyway, time will tell what happens, but I'd say risk/reward ratio is tipping in favor of selling at this point.

10/15/2009

Shorting EUR/USD between 1.50 and 1.60

Dollar sentiment appears to be hittings rock bottom. Check out this link on Carl Futia's blog, as well as this post on G-Rahal's blog for good examples. In addition, the EUR/USD is nearing strong resistance. I think we should get a retest of 1.25, and ultimately, a drop to .9-1.0. Thus, I will be scaling in shorts between 1.49 and 1.60.

You can see here that there are three strong trendlines that have been breached to the downside. They should act as good resistance to further gains. However, if price closes above the lower trendline (where price currently stands) for two months, I will close out the trade.

This chart above shows the COT data for the EUR. Notice that commercial traders are at bearish extremes for the EUR. Not a good sign for strength in my opinion.

Similarly, Commercial traders are holding highly-long positions in the Dollar. The combination of short EUR and long USD makes a down-move in EUR/USD more probable.

10/13/2009

Is Monsanto Losing It's Touch?

I just noticed an article about Monsanto reporting about a potential Anti-trust investigation by the US Justice Dept (see this link). I then took a look at the chart, and saw an intriguing short opportunity. Perhaps Monsanto is nearing the beginning of the end of its food supply domination? I would short this around $76 with a stop above $87. Target? $20.

Notice that MON broke it's long-term uptrend, and has since been consolidating the losses. However, notice that after an initial rally to $95, it has been downtrending. This is in stark contrast to what the rest of the market has done:

You can see on the SPY weekly chart that after the first leg up, the market rested for a couple weeks. But then, unlike MON, SPY broke sharply higher. This underperformance by MON makes me more confident in shorting MON. It'll be interesting to see how this plays out.

10/07/2009

Sentiment hitting bullish extremes = reversal imminent

I think sentiment is reaching bullish extremes in the midst of strong distribution from the smart money. In addition, the market is blowing off in the midst of global good news, which leads me to believe that we'll reverse tomorrow or Friday to end the week much below SPX 1080, and likely not make a new closing high.

It's quite amazing actually: there's usually a mix of bullish and bearish bloggers, but at turning points it's really interesting to notice how everyone, even the previously bearish people, switch to attempt to trade "one more rally before the turn." Here's my analysis of the blogs I follow (see links on sidebar):

Carl Futia: normally bullish, currently looking for a rally to 1120
George Rahal: switched to bullish at the Friday low (nice!) but looking for new highs
Kevin's Market Blog: was cautious at end of Sept, but is now looking for retest of highs
Bespokeinvest: neutral
Slopeofhope: bearish, but only 10% short, waiting for that final pop to enter fully
Elliot Wave Lives On: had a mostly bearish wave count, but switched to more bullish wave count today
Gary's Common Sense: cautiously bullish
Evilspeculator: just capitulated his bearish position for that "one last rally"
X-trends: normally ultra bearish, but now open to possibility of a bull-orgy climax

To sum up: nearly everyone is on or has jumped on the "one last rally" boat. Take a look at this chart below that shows investor pain (from www.marketpsych.com):


We're not even at new highs but everyone is happy to enjoy the expected ride to above 1080, at which point they'll sell. I guess I'll be on the other boat and say that we're not going to new closing highs.

The second point is that this rally is terminating on good news. In fact, the rally from Friday's low has been ignited by Australia. On Monday, they raised rates, and today they reported job growth vs. job losses. Sounds bullish, right? Take a look at the AUD/USD chart below:

This 20-y chart looks bearish to me, as we're retesting the trendline that was broken to end the 8-year uptrend. This leads me to believe that we're witnessing the end of the rally coming on the good news. You can see the same thing on the long-term SPY chart below:

Again we're hearing all this great news about the global economy about how things are getting better. However, all I see is that we're retesting the bottom of a 20-year uptrend that was finally broken last year. Notice how volume increased on the decline and has decreased on the rally?

Finally, in the midst of the bullish sentiment and "strong recovery," we're seeing strong distribution by the strong hands. Check out the daily chart of SPY below:
We have 5 distribution days in the past month, indicative of strong selling by the market drivers (institutions). William O'Neil (founder of IBD) correlates this with a high possibility of a trend change. This indicator has worked very well in the past for me, probably 4 out of 5 times. In addition, we're retesting the underside of the uptrend that began in mid-July.

All-in-all, we're seeing excessive bullishness in the midst of distribution and good economic news. I will aggressively short any rally, and I do not expect the market to make it much higher from here.

9/30/2009

It's official, distribution is here

I'm glad that I'm back to a nearly fully-short position, because today marks the fifth day that we've seen heavy distribution in the past month. I'm looking for a sharp breakdown any day now, and I think those who are waiting for 1100+ will be left in the dust.

9/28/2009

90% short, will add more on rallies through SPX 1130

I think it would be too obvious if the mkt rallied at this point. The fact that I switched to bullish after a 60% rally tells me that I'm being the sucker. I don't want to be less than 90% short, and will add more if the market rallies higher.

9/24/2009

Tricky market bottoming here

I am net short as I've been for the entire rally. However, today, I closed out 25% of my position at SPX 1050, as I am not expecting a rally back to new highs above 1080 to finish out this rally.

Notice that there is strong trendline resistance at /ES 1130. I will reenter into my full position in the 1080-1130 range. Notice the MACD divergence is portending a strong decline coming up, so I'm just closing out part of my short position, instead of the whole thing.

I like this chart the best. Notice that we need one more up wave to finish wave-c. Wave-ii of Wave-c was a normal 3-wave zig-zag. Wave-iv of Wave-c looks like it's an irregular flat where both longs and shorts get whipsawed--first with the fed spike yesterday, and then with the plunge this morning. This is one of my favorite patterns; I haven't seen one formed like this in months, so I'm happy to make a bet on this one.

Good luck to all!

8/06/2009

XLF nearing a top

I think XLF should print a top in the $14-16 range and then start a downtrend back to the $10 range. I will start scaling in short positions in this zone.

Notice on this long-term chart that XLF is backtesting some strong trendlines. These should provide overhead resistance.

On the daily chart, it definately looks like XLF is carving out an ABC, especially considering that price busted above $13 without a pullback beforehand. Furthermore, price is going parabolic into WaveC which tells me that sentiment is becoming too bullish. We could see price rally into the $16 zone, but there should be a $3-6+ correction soon.


8/05/2009

Shorting NZD/USD

I think the US Dollar is nearing a bottom (as I posted here) as many people are bearish and few are bullish. I'm trading this speculation by shorting NZD/USD in the .67-.72 range with a target at .50 and below.

You can see in the 10-year chart above that there is good resistance in the .67 to .72 range. We've had a nice ABC-flat rally since prices tanked back in 2008, and based on the dollar, I think this currency could be ready start the next leg in its downtrend.

7/31/2009

Taking a big risk

I think the US Dollar index is about ready to start a strong uptrend. However, I would like to see a rally to 80 or higher in the next week to confirm this pattern.

Notice in the upper frame of the daily chart above that price is standing at an uptrend support line. Also, it appears that price action has traced out a flat ABC correction since the Dec. 2008 top (notice the clear 3-3-5 formation). It looks like Wave-v of Wave-c appears to be an ending diagonal, so today's drop in the USD should quickly reverse if my analysis is correct. Also, commercial traders are holding their largest long position in the past year.

All these bullish factors are mitigated by the fact that retail traders are super-long USDl. I need to see the reversal quickly, otherwise the bullish sentiment from retailers could cause it to drop quickly.