10/30/2009

Monsanto update

I last posted about Monsanto here. I was calling for declines based on a severely underperforming stock price. Currently, it looks like things are unfolding according to plan. If we rally to $75 or so, I may add more to my short position.

You can see in the weekly chart above that MON has broken it's bear flag pattern to the downside, and looks like it will easily close the week below. I would like to see a rally to $75, a retest of the breakout line, to add more shorts.

10/21/2009

Distribution keeps on coming...

...the smart money unloading on the dumb money. We now have 7 distribution days in the past month, and MACD divergence. Watch out below!

(you can see the distribution days and MACD div on the SPY daily chart above)

Furthermore, we're getting major divergence on the 5- and 10-dma Advance/Decline issues. Much fewer stocks participated in this last rally from the October lows. We're heading down :).


10/20/2009

"Could Apple's Run be Over?" -- Revisited

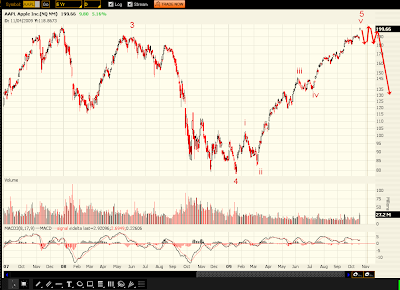
Back in Spring '08, when AAPL was making it's 2nd major test of $200, I projected that it was possibly at the end of its bull-market. We're now back at $200 and AAPL has just reported it's best earnings ever. Once again, however, I am pessimistic on AAPL's future. I believe we are within $10-20 of it's high price for the next couple years.

Above is AAPL's weekly chart. From an Elliot Wave perspective, notice that it is nearly finished with a 5-wave rally since its resurgence when Steve Jobs retook the helm as CEO in the late 1990's. Notice that throughout the bull run, up through the end of Wave3, there had been increasing volume (even at higher share prices). However, on this 5th wave advance from $85, volume has been shrinking. In Elliot Wave Principle, Robert Prechter explains, "...look for lesser volume as a rule in a fifth wave as opposed to the third." This is exactly what is happening now, not a very bullish sign going forward. My downside target range is from $50-80.

So, if we are in the fifth wave of AAPL's advance, how close is it to being finished? The wave count is a little bit unclear, but there are 5-waves up, so it could be nearly complete. It would be funny if the earnings pop left an island top in place, but I'm open to the possibility that we head a bit higher and form a topping pattern before reversal.

On a different note, I did see some bearish option activity today as well. My Jan '11 40 put on AAPL actually increased in value today, in the face of a 5% spike up. Clearly someone is willing to bid up the OTM, long-dated options on this strength.

Anyway, time will tell what happens, but I'd say risk/reward ratio is tipping in favor of selling at this point.

10/15/2009

Shorting EUR/USD between 1.50 and 1.60

Dollar sentiment appears to be hittings rock bottom. Check out this link on Carl Futia's blog, as well as this post on G-Rahal's blog for good examples. In addition, the EUR/USD is nearing strong resistance. I think we should get a retest of 1.25, and ultimately, a drop to .9-1.0. Thus, I will be scaling in shorts between 1.49 and 1.60.

You can see here that there are three strong trendlines that have been breached to the downside. They should act as good resistance to further gains. However, if price closes above the lower trendline (where price currently stands) for two months, I will close out the trade.

This chart above shows the COT data for the EUR. Notice that commercial traders are at bearish extremes for the EUR. Not a good sign for strength in my opinion.

Similarly, Commercial traders are holding highly-long positions in the Dollar. The combination of short EUR and long USD makes a down-move in EUR/USD more probable.

10/13/2009

Is Monsanto Losing It's Touch?

I just noticed an article about Monsanto reporting about a potential Anti-trust investigation by the US Justice Dept (see this link). I then took a look at the chart, and saw an intriguing short opportunity. Perhaps Monsanto is nearing the beginning of the end of its food supply domination? I would short this around $76 with a stop above $87. Target? $20.

Notice that MON broke it's long-term uptrend, and has since been consolidating the losses. However, notice that after an initial rally to $95, it has been downtrending. This is in stark contrast to what the rest of the market has done:

You can see on the SPY weekly chart that after the first leg up, the market rested for a couple weeks. But then, unlike MON, SPY broke sharply higher. This underperformance by MON makes me more confident in shorting MON. It'll be interesting to see how this plays out.

10/07/2009

Sentiment hitting bullish extremes = reversal imminent

I think sentiment is reaching bullish extremes in the midst of strong distribution from the smart money. In addition, the market is blowing off in the midst of global good news, which leads me to believe that we'll reverse tomorrow or Friday to end the week much below SPX 1080, and likely not make a new closing high.

It's quite amazing actually: there's usually a mix of bullish and bearish bloggers, but at turning points it's really interesting to notice how everyone, even the previously bearish people, switch to attempt to trade "one more rally before the turn." Here's my analysis of the blogs I follow (see links on sidebar):

Carl Futia: normally bullish, currently looking for a rally to 1120
George Rahal: switched to bullish at the Friday low (nice!) but looking for new highs
Kevin's Market Blog: was cautious at end of Sept, but is now looking for retest of highs
Bespokeinvest: neutral
Slopeofhope: bearish, but only 10% short, waiting for that final pop to enter fully
Elliot Wave Lives On: had a mostly bearish wave count, but switched to more bullish wave count today
Gary's Common Sense: cautiously bullish
Evilspeculator: just capitulated his bearish position for that "one last rally"
X-trends: normally ultra bearish, but now open to possibility of a bull-orgy climax

To sum up: nearly everyone is on or has jumped on the "one last rally" boat. Take a look at this chart below that shows investor pain (from www.marketpsych.com):


We're not even at new highs but everyone is happy to enjoy the expected ride to above 1080, at which point they'll sell. I guess I'll be on the other boat and say that we're not going to new closing highs.

The second point is that this rally is terminating on good news. In fact, the rally from Friday's low has been ignited by Australia. On Monday, they raised rates, and today they reported job growth vs. job losses. Sounds bullish, right? Take a look at the AUD/USD chart below:

This 20-y chart looks bearish to me, as we're retesting the trendline that was broken to end the 8-year uptrend. This leads me to believe that we're witnessing the end of the rally coming on the good news. You can see the same thing on the long-term SPY chart below:

Again we're hearing all this great news about the global economy about how things are getting better. However, all I see is that we're retesting the bottom of a 20-year uptrend that was finally broken last year. Notice how volume increased on the decline and has decreased on the rally?

Finally, in the midst of the bullish sentiment and "strong recovery," we're seeing strong distribution by the strong hands. Check out the daily chart of SPY below:
We have 5 distribution days in the past month, indicative of strong selling by the market drivers (institutions). William O'Neil (founder of IBD) correlates this with a high possibility of a trend change. This indicator has worked very well in the past for me, probably 4 out of 5 times. In addition, we're retesting the underside of the uptrend that began in mid-July.

All-in-all, we're seeing excessive bullishness in the midst of distribution and good economic news. I will aggressively short any rally, and I do not expect the market to make it much higher from here.