Gold was all over the news last week as it was raging to new highs. I now think that it may be near the end of it’s uptrend, and I’m shorting KGC (Kinross Gold) as a proxy for gold, with an order to exit if GLD makes a new high.
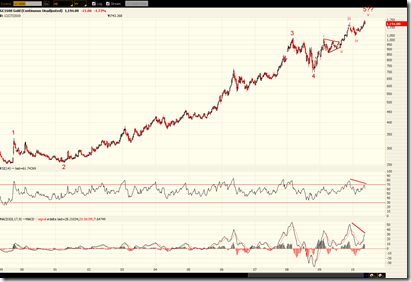
My first chart shows yearly candles for gold. Notice that we’ve had 10 straight years of higher prices in gold. Gold is the “no-lose” investment today. Even if gold eventually does hit $2,000/oz as many people expect, I think we need an intermediate term correction that creates a down-year candle to shake some people out. Even the massive inflation in the 1970’s only lasted for 4 years. Furthermore, we are seeing the weakest inflation in 44 years, even with the trillions and trillions of dollars that governments are printing. This implies massive deflationary forces which could spell weakness for gold.
The next chart shows weekly bars for the past 11 years. From an Elliot Wave perspective, notice that 5-waves have completed. Often times, commodities will have a massive rush as the trend ends, but my thesis is that perhaps we will see an intermediate correction before we get this massive rush. A correction could take gold to the Wave-4 low of $700. There is clear RSI and MACD divergence, but these have yet to be confirmed.
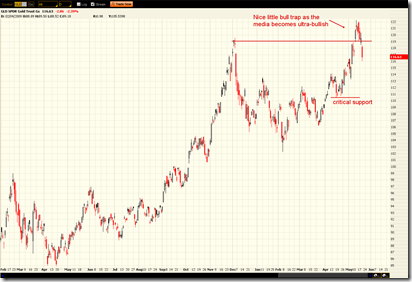
The daily chart above shows a very interesting phenomenon that occurred last week as the media was excessively bullish on gold. Notice that price broke out above the previous high and stayed above there for several days, enough to convince people that it was a real breakout. Then today it gapped lower, trapping all the bulls badly. If this false breakout is significant, we should not see a new high, and thus I am placing my stop at that level.
One other interesting chart which shows the excessiveness of gold’s rally is the weekly candles of gold priced in euros. Notice the clear parabolic nature of that rally. Once again, no matter how badly the press portrays the situation, parabolas are unsustainable. Either gold will tank, or the euro will rally, or both.
Finally, take a look at the daily chart for KGC. Most gold stocks have slightly underperformed gold, but not nearly to the extent that KGC has. Its relative strength to GDX (a gold stocks index) has been weakening ever since gold bottomed in 2008. Since gold stocks tend to leverage moves in gold, I see KGC as a good stock to short; if gold drops, KGC should drop harder than most gold stocks, and if gold rallies, KGC may continue to underperform, thus lowering my risk.
It’ll be interesting to monitor what gold does in the near future. It’s obviously too early to call a long-term top in gold, but I’ll try to catch a rising knife at this point. If gold makes a new high, I’ll know that I’m wrong on the short-term.


No comments:
Post a Comment